Free Access
Fig. A.1
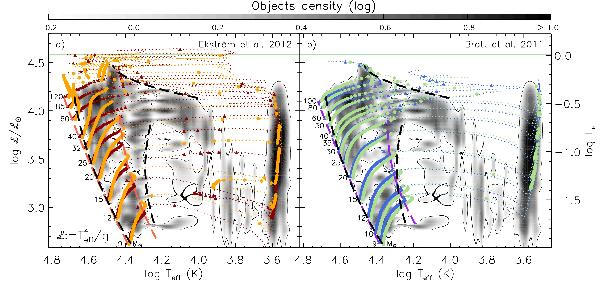
As in Fig. 1, but including rotating stellar evolution tracks: a) models of Ekström et al. (2012) with an initial rotational velocity of 40% of critical rotation (orange dotted lines and dots) and; b) models of Brott et al. (2011) with an initial rotational velocity of 300 km s-1 (green dotted lines and dots).
Current usage metrics show cumulative count of Article Views (full-text article views including HTML views, PDF and ePub downloads, according to the available data) and Abstracts Views on Vision4Press platform.
Data correspond to usage on the plateform after 2015. The current usage metrics is available 48-96 hours after online publication and is updated daily on week days.
Initial download of the metrics may take a while.