Fig. 1
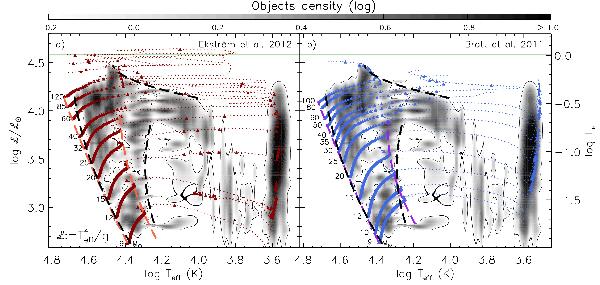
Grey scale representation of the probability density distribution of the location of 575 Galactic stars in the sHRD. Three empirical borderlines between densely populated regions and empty regions are drawn as black dashed lines (cf. Table 1). The electron scattering Eddington factor (Γe) is given on the right ordinate axis. The Γe limit for hydrogen-rich composition at log L/ L⊙ = 4.6 is represented by a green horizontal line. Overlayed are stellar evolution tracks for non-rotating stars with solar composition: a) Ekström et al. (2012) and, b) Brott et al. (2011). The ZAMS and TAMS positions of the models are connected through orange and purple dashed lines. Red and blue triangles are placed on the tracks separated by 0.1 Myr.
Current usage metrics show cumulative count of Article Views (full-text article views including HTML views, PDF and ePub downloads, according to the available data) and Abstracts Views on Vision4Press platform.
Data correspond to usage on the plateform after 2015. The current usage metrics is available 48-96 hours after online publication and is updated daily on week days.
Initial download of the metrics may take a while.