Fig. 2
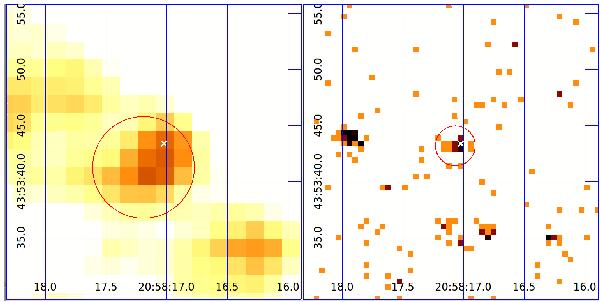
Maps for XMM2 (left; pixel size 1.6′′, energy range =0.3−7 keV) and CXO1 observations (right; pixel size 0.49′′, energy range =0.5−10 keV). The circles show the extraction regions (radii =4.5′′ and 1.76′′ for XMM2 and CXO1, respectively), centered at the wavdetect source coordinates. The crosses mark the 2MASS position (Cutri et al. 2003). The XMM-Newton image has been smoothed with a Gaussian.
Current usage metrics show cumulative count of Article Views (full-text article views including HTML views, PDF and ePub downloads, according to the available data) and Abstracts Views on Vision4Press platform.
Data correspond to usage on the plateform after 2015. The current usage metrics is available 48-96 hours after online publication and is updated daily on week days.
Initial download of the metrics may take a while.