Free Access
Fig. 1
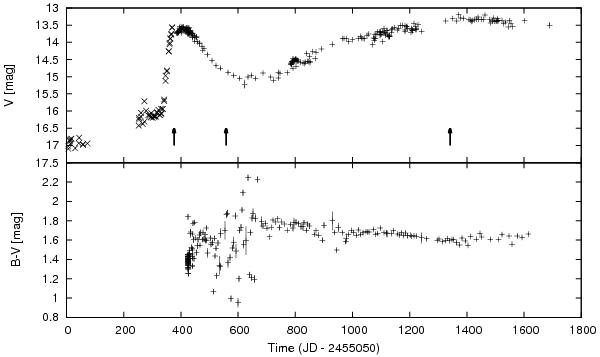
V (top) and B − V (bottom) light curves of HBC 722 from aavso.org (+ symbols), complemented by R-band data from Miller et al. (2011) (top, early rise phase, × symbols). The three arrows mark the XMM1, XMM2, and CXO1 observing dates (left to right; Table 1).
Current usage metrics show cumulative count of Article Views (full-text article views including HTML views, PDF and ePub downloads, according to the available data) and Abstracts Views on Vision4Press platform.
Data correspond to usage on the plateform after 2015. The current usage metrics is available 48-96 hours after online publication and is updated daily on week days.
Initial download of the metrics may take a while.