Free Access
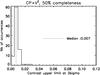
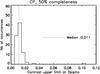
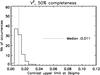
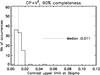
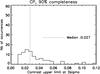
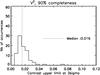
Fig. 4

Histogram of the 3σ contrast upper limit for 50% (top) and for 90% (bottom) of the field of view, for the combination of CP and V2 (left), the CP only (middle), and the V2 only (right).
This figure is made of several images, please see below:
Current usage metrics show cumulative count of Article Views (full-text article views including HTML views, PDF and ePub downloads, according to the available data) and Abstracts Views on Vision4Press platform.
Data correspond to usage on the plateform after 2015. The current usage metrics is available 48-96 hours after online publication and is updated daily on week days.
Initial download of the metrics may take a while.