Fig. 9
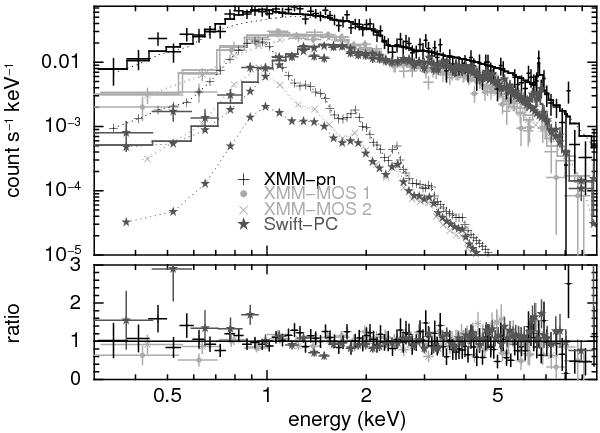
XMM-Newton-EPIC (2011 Nov.) and Swift-XRT (2013 Aug.) spectra of V751 Cyg, fitted with two absorbed optically thin emission components (the separate components are shown by the fainter dotted lines) and a narrow Gaussian line, as detailed in the text and Table 2. The model lines are from the fit with the emission parameters tied between the EPIC and XRT spectra; only the absorbing column was allowed to differ.
Current usage metrics show cumulative count of Article Views (full-text article views including HTML views, PDF and ePub downloads, according to the available data) and Abstracts Views on Vision4Press platform.
Data correspond to usage on the plateform after 2015. The current usage metrics is available 48-96 hours after online publication and is updated daily on week days.
Initial download of the metrics may take a while.