Free Access
Fig. 6
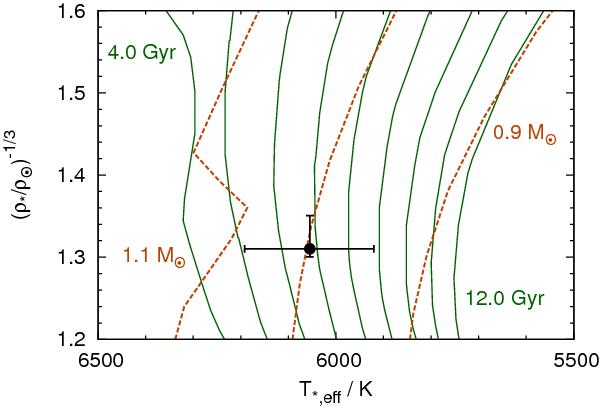
Modified Hertzsprung-Russell diagram for WASP-106 (black circle). Isochrones (solid green lines) from the models of Bressan et al. (2012) are plotted for ages between 4.0 and 12.0 Gyr, spaced at 1.0 Gyr intervals. Also shown are evolutionary tracks (dashed orange lines) for 0.9, 1.0 and 1.1 M⊙ from Bertelli et al. (2008).
Current usage metrics show cumulative count of Article Views (full-text article views including HTML views, PDF and ePub downloads, according to the available data) and Abstracts Views on Vision4Press platform.
Data correspond to usage on the plateform after 2015. The current usage metrics is available 48-96 hours after online publication and is updated daily on week days.
Initial download of the metrics may take a while.