Fig. 2
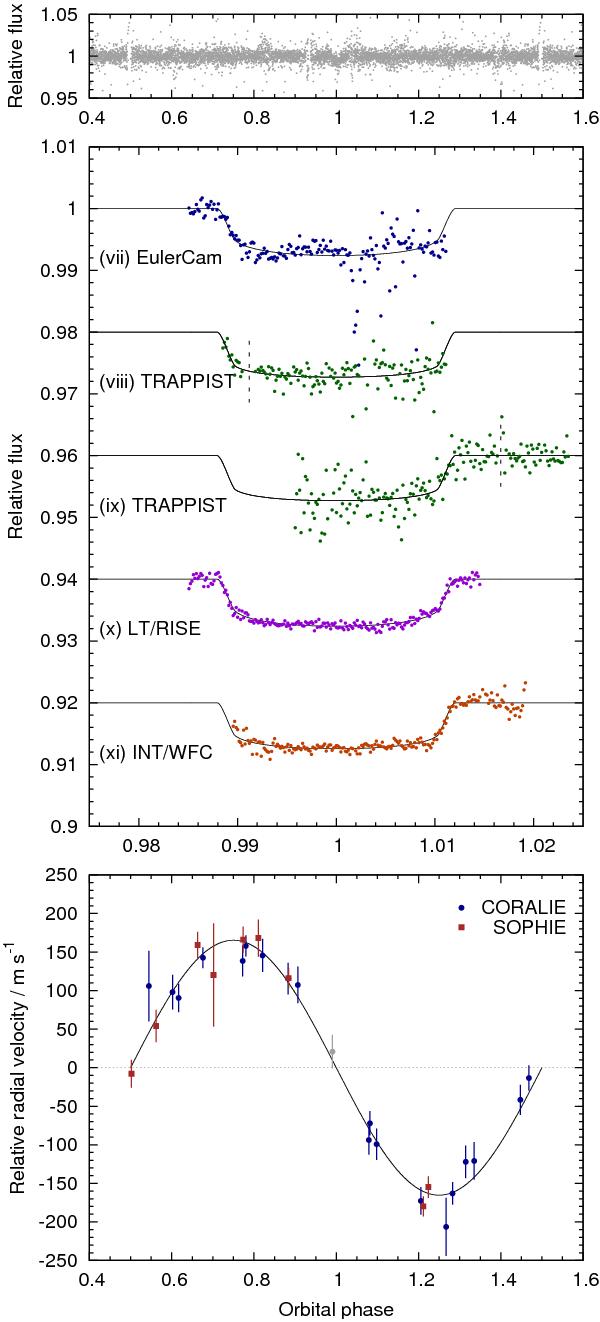
WASP-106 photometry and radial velocities. Upper panel: phase-folded photometry from SuperWASP-N and WASP-South. Data are binned in phase with a bin-width equal to 120 s. Middle panel: high-precision follow-up photometry. Each light curve is offset in flux for clarity, and binned using a 120 s bin width. The light curves are identified with the same numbers as those in Table 2. Our best-fitting model is plotted with a solid line and TRAPPIST’s meridian flips are marked with dashed vertical lines. Lower panel: RV measurements from CORALIE and SOPHIE, along with our best-fitting MCMC solution (solid line). The CORALIE point taken during transit and excluded from our MCMC analysis is shown in grey. The centre-of-mass velocity, γ = 17.24744 km s-1, has been subtracted, as has the fitted offset γCOR − SOPH = −59.57 m s-1 between the two datasets.
Current usage metrics show cumulative count of Article Views (full-text article views including HTML views, PDF and ePub downloads, according to the available data) and Abstracts Views on Vision4Press platform.
Data correspond to usage on the plateform after 2015. The current usage metrics is available 48-96 hours after online publication and is updated daily on week days.
Initial download of the metrics may take a while.