Fig. 3
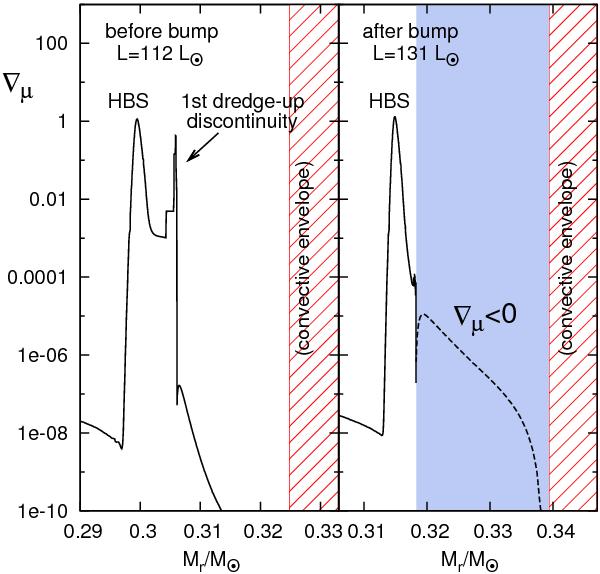
Profile of the mean molecular weight gradient ∇μ as a function of mass. Solid line stands for ∇μ> 0 regions and the dashed line for all other cases. Left and right panels correspond to the situation before and after the bump, respectively, for the model of 0.9 M⊙, [ Fe/H ] = −1.3. HBS: hydrogen burning shell; shaded zone: fingering unstable region; hatched area: innermost part of the convective envelope. The left and right panels are separated by 9.7 Myr of evolution.
Current usage metrics show cumulative count of Article Views (full-text article views including HTML views, PDF and ePub downloads, according to the available data) and Abstracts Views on Vision4Press platform.
Data correspond to usage on the plateform after 2015. The current usage metrics is available 48-96 hours after online publication and is updated daily on week days.
Initial download of the metrics may take a while.