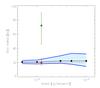
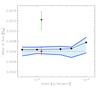
Fig. 4
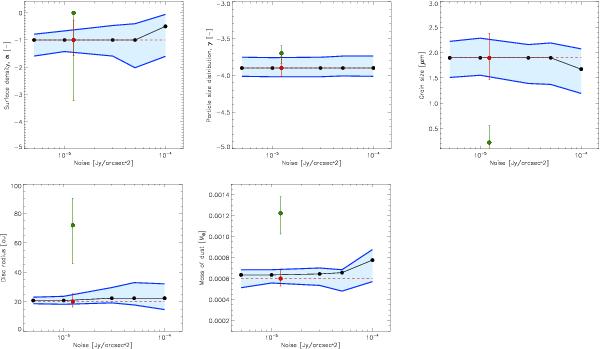
Recovered model parameter values as a function of image noise for the first model, based on the best fit to observations of HIP 22263. Top row: surface density, α, particle size distribution, γ, and minimum grain size, smin. Bottom row: disc peak radius, r0, and dust mass, Mdust. The red data point denotes the results for the observed SED and radial profiles, with the red dashed line denoting the input value to the model for each parameter. The green data point denotes a fit to only the observed SED. The black data points denote models fitted to both the SED and radial profiles with increasing noise contributions with the envelope of uncertainties for the models marked by the light blue shaded region, bounded by the dark blue lines.
Current usage metrics show cumulative count of Article Views (full-text article views including HTML views, PDF and ePub downloads, according to the available data) and Abstracts Views on Vision4Press platform.
Data correspond to usage on the plateform after 2015. The current usage metrics is available 48-96 hours after online publication and is updated daily on week days.
Initial download of the metrics may take a while.