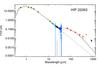
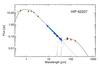
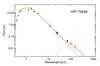
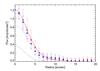
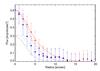
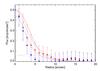
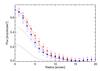
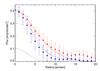
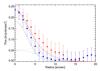
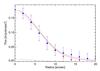
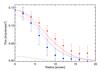
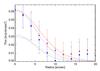
Fig. 3
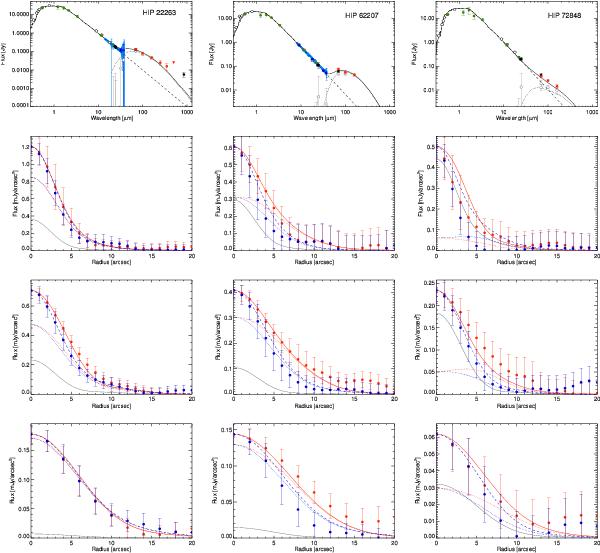
GRaTeR results: Top row: spectral energy distributions of HIP 22263, HIP 62207, and HIP 72848 (left to right), calculated from the simultaneous best fit model. Empty data points are photosphere measurements, black data points are ancillary mid- and far-infrared measurements, green data points are the flux densities used to scale the photosphere model, dark blue data points are flux densities extracted from the Spitzer IRS spectrum, represented by the light blue data points, and red data points are the Herschel PACS and SPIRE flux densities. The combined photosphere and disc model is a solid black line. The disc and photosphere model components are represented by dotted and dashed lines, respectively. Lower rows: observed radial profiles of each target at 70, 100, and 160 μm (top to bottom). The major and minor axis measured values are denoted by the red and blue data points, respectively. The model major and minor axis radial profiles are represented by the red solid line and blue dashed line. The disc contribution is represented by the dotted lines and the stellar contribution is shown as a solid grey line.
Current usage metrics show cumulative count of Article Views (full-text article views including HTML views, PDF and ePub downloads, according to the available data) and Abstracts Views on Vision4Press platform.
Data correspond to usage on the plateform after 2015. The current usage metrics is available 48-96 hours after online publication and is updated daily on week days.
Initial download of the metrics may take a while.