Fig. 8
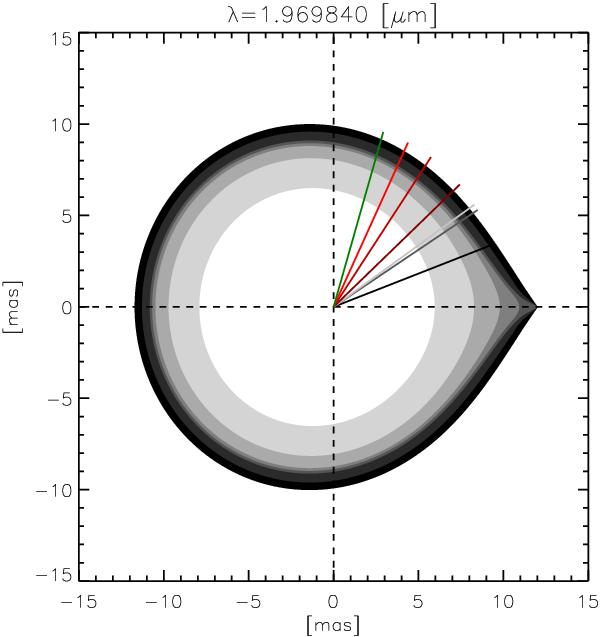
Intensity map of the Roche lobe model for one of the AMBER low-resolution spectral channels. The lines represent the direction of the projected baselines used to simulate the interferometric data. Since the location of the close companion and the orientation of the orbital plane are unknown, the depicted Roche lobe orientation illustrates only one possible solution.
Current usage metrics show cumulative count of Article Views (full-text article views including HTML views, PDF and ePub downloads, according to the available data) and Abstracts Views on Vision4Press platform.
Data correspond to usage on the plateform after 2015. The current usage metrics is available 48-96 hours after online publication and is updated daily on week days.
Initial download of the metrics may take a while.