Fig. 10
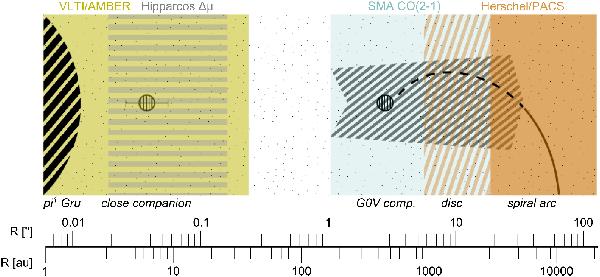
Illustration of the surroundings of π1 Gru including the close companion, the disc, the G0V companion, and the spiral arc. The coloured areas represent the field of view or detection range of the used instrument: olive represents the VLTI/AMBER range, horizontal grey lines the Hipparcos Δμ constraint, light blue the SMA CO(2-1) observations, and dark orange the partly overlapping Herschel/PACS field of view.
Current usage metrics show cumulative count of Article Views (full-text article views including HTML views, PDF and ePub downloads, according to the available data) and Abstracts Views on Vision4Press platform.
Data correspond to usage on the plateform after 2015. The current usage metrics is available 48-96 hours after online publication and is updated daily on week days.
Initial download of the metrics may take a while.