Fig. 3
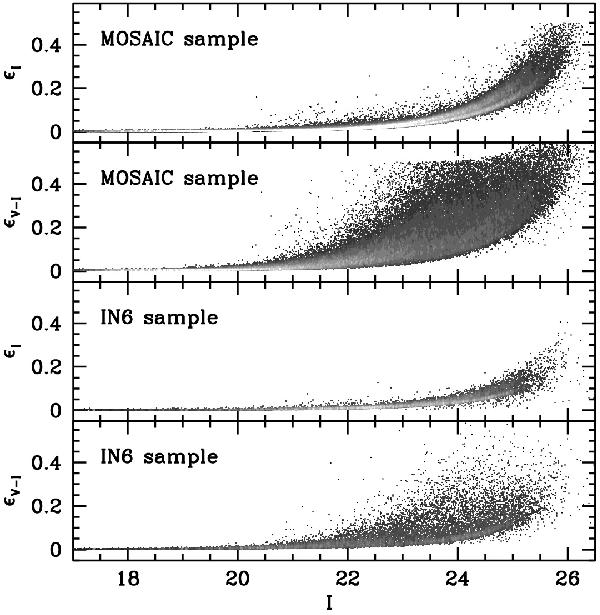
Distribution of photometric errors in magnitude and colours for the two samples, MOSAIC (upper two panels), and IN6 (lower two panels). Stars are plotted as black points in regions of the diagrams with a few stars and as grey squares otherwise, with the scale of grey proportional to the local density. Lighter tones of grey correspond to higher density.
Current usage metrics show cumulative count of Article Views (full-text article views including HTML views, PDF and ePub downloads, according to the available data) and Abstracts Views on Vision4Press platform.
Data correspond to usage on the plateform after 2015. The current usage metrics is available 48-96 hours after online publication and is updated daily on week days.
Initial download of the metrics may take a while.