Fig. 12
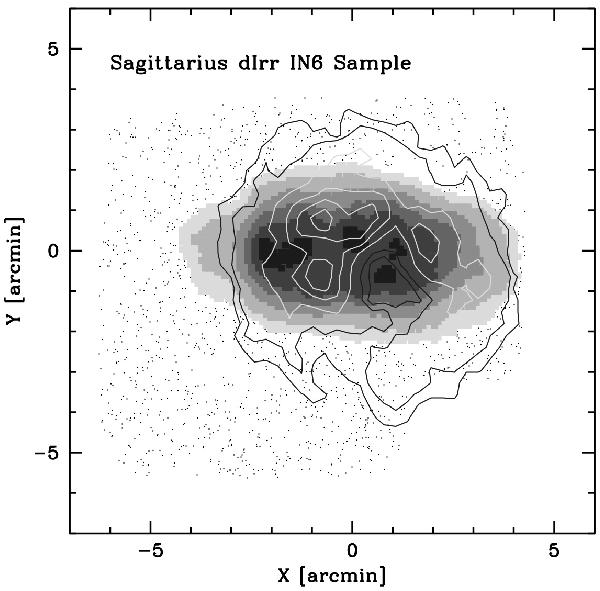
Density map obtained with the matched filter technique from the IN6 sample. The symbols are the same as in Fig. 11. A higher level of smoothing has been adopted. The H i column density contours obtained from LITTLE THINGS data (with a beam of 28.2″ × 16.9″) were superimposed. The associated density is 0.5, 1.0, 3.0, 5.0, 7.0, 9.0 × 1020 cm-2, from the outermost to the innermost contour.
Current usage metrics show cumulative count of Article Views (full-text article views including HTML views, PDF and ePub downloads, according to the available data) and Abstracts Views on Vision4Press platform.
Data correspond to usage on the plateform after 2015. The current usage metrics is available 48-96 hours after online publication and is updated daily on week days.
Initial download of the metrics may take a while.