Fig. 11
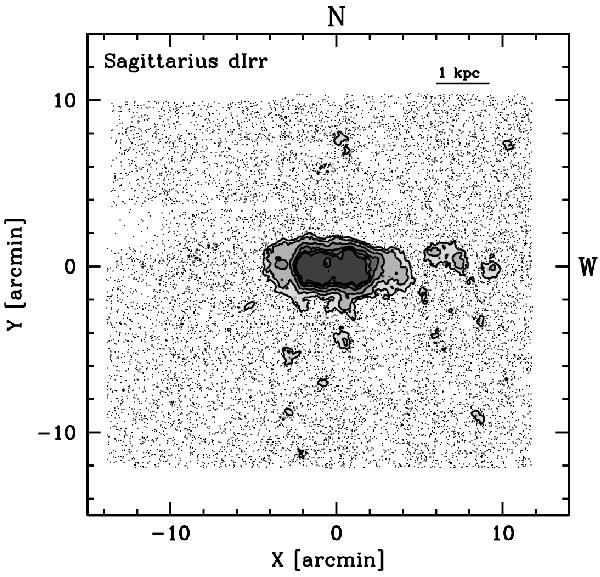
Density map obtained from RGB star counts. The levels of grey correspond to density of 3, 5, 10, 20, 40, and 80σ above the background, from the lightest to the darkest tone of grey. All the RGB stars falling in the selection box defined in Fig. 9 are also plotted (as dots) to provide a direct illustration of the effects of the footprint of the mosaic.
Current usage metrics show cumulative count of Article Views (full-text article views including HTML views, PDF and ePub downloads, according to the available data) and Abstracts Views on Vision4Press platform.
Data correspond to usage on the plateform after 2015. The current usage metrics is available 48-96 hours after online publication and is updated daily on week days.
Initial download of the metrics may take a while.