Fig. 8
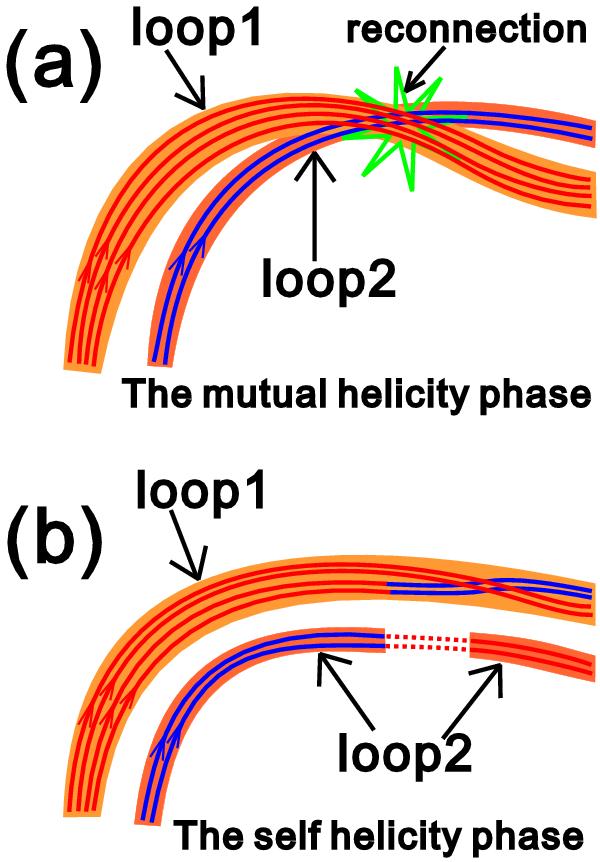
Schematic diagrams illustrating the configurations of two loops, the orange-colored broad lines of loop 1 and loop 2, during the mutual helicity a) and the self-helicity phases b). The red lines in a) show the magnetic field lines of loop 1, the blue lines show the field lines of loop 2. The green star denotes magnetic reconnection. The red-blue lines in b) indicate the reconnected lines,the dotted red lines show loops that are not detected in Si IV images. The red and blue arrows show the directions of the magnetic field lines.
Current usage metrics show cumulative count of Article Views (full-text article views including HTML views, PDF and ePub downloads, according to the available data) and Abstracts Views on Vision4Press platform.
Data correspond to usage on the plateform after 2015. The current usage metrics is available 48-96 hours after online publication and is updated daily on week days.
Initial download of the metrics may take a while.