Fig. 5
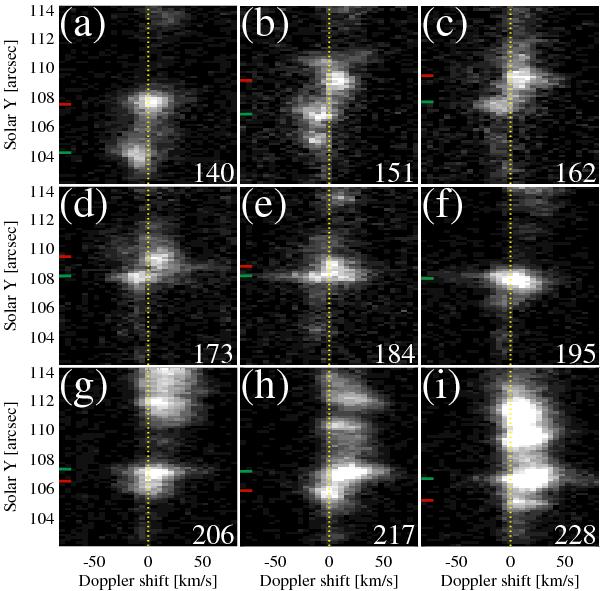
Line profiles of Si IV (1394 Å) during the mutual-helicity phase. The spatial location of these spectra is indicated in Fig. 4 by the vertical dashed lines a−i. The red and green markers show the location of the two loops (red and green dotted lines in Fig. 4a). The numbers in the plot indicate the raster index, the vertical dotted lines the zero Doppler shift.
Current usage metrics show cumulative count of Article Views (full-text article views including HTML views, PDF and ePub downloads, according to the available data) and Abstracts Views on Vision4Press platform.
Data correspond to usage on the plateform after 2015. The current usage metrics is available 48-96 hours after online publication and is updated daily on week days.
Initial download of the metrics may take a while.