Free Access
Fig. 3
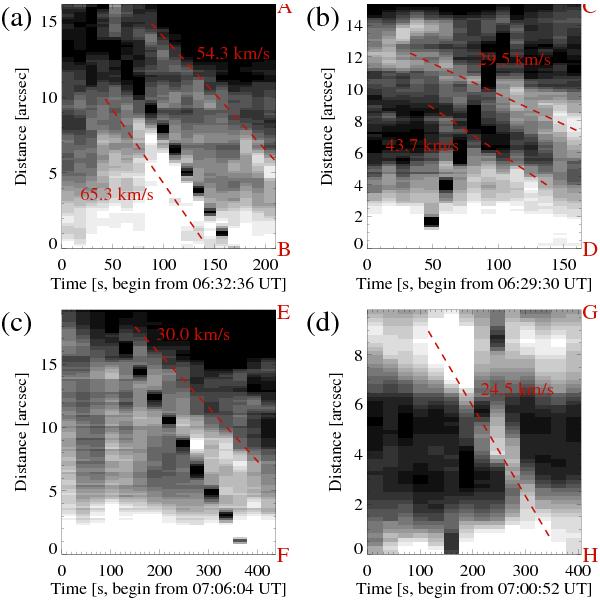
Proper motions along the Si IV loops. Time-space plots of a series of IRIS slit-jaw images at 1400 Å along the dashed lines AB a), CD b), EF c), and GH d), as marked in Figs. 1b and c. The red dashed lines show motions along the loops. The respective velocities are denoted by the numbers in the plots.
Current usage metrics show cumulative count of Article Views (full-text article views including HTML views, PDF and ePub downloads, according to the available data) and Abstracts Views on Vision4Press platform.
Data correspond to usage on the plateform after 2015. The current usage metrics is available 48-96 hours after online publication and is updated daily on week days.
Initial download of the metrics may take a while.