Fig. 2
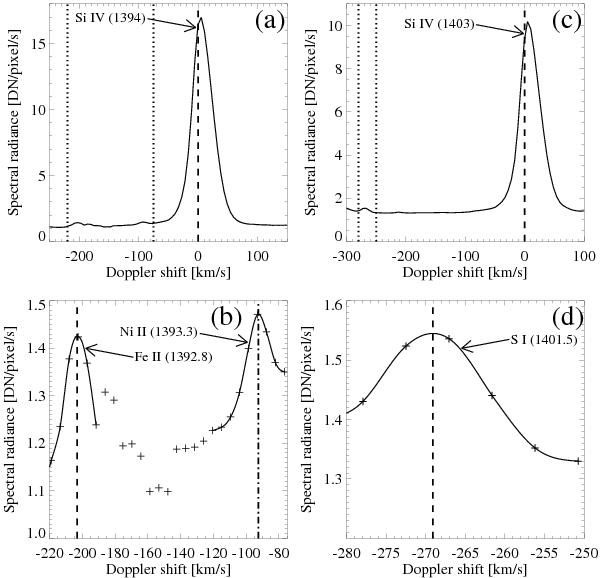
Line profiles used for wavelength calibration averaged over the whole FOV of the raster map. Panels a) and b) show the profile during the second raster. The main target line Si IV at 1394 Å is visible in a). The vertical dotted lines indicate the wavelength region shown in panel b), where we zoom in on the lines of Ni II and Fe II that were used for wavelength calibration. The pluses show the actual observed spectrum, the solid line a spline fit around the center of the calibration lines. The vertical dashed lines indicate the peak of the spline fit. Panels c) and d) show the same for the third raster scan in the self-helicity phase. Here the S I line was used for wavelength calibration and the main target line was Si IV at 1403 Å. The count rate is per 0.166′′×0.166′′ pixel.
Current usage metrics show cumulative count of Article Views (full-text article views including HTML views, PDF and ePub downloads, according to the available data) and Abstracts Views on Vision4Press platform.
Data correspond to usage on the plateform after 2015. The current usage metrics is available 48-96 hours after online publication and is updated daily on week days.
Initial download of the metrics may take a while.