Fig. 1
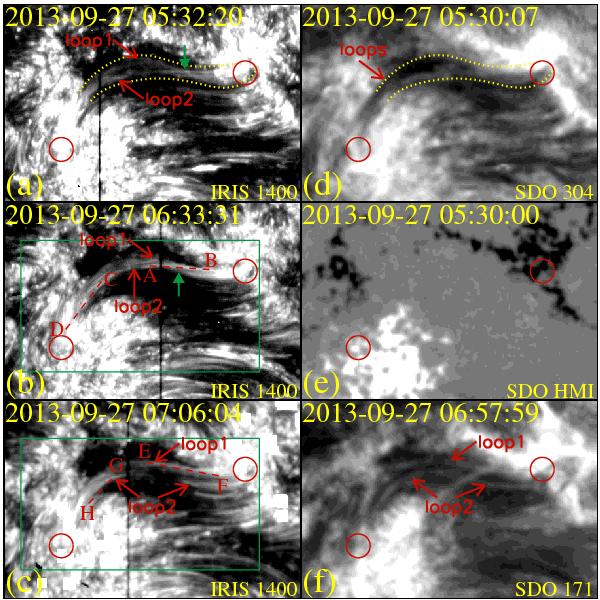
IRIS slit-jaw images and context from AIA and HMI. The left panels a)−c) show snapshots of the IRIS slit-jaw images during the three raster scans. The right panels show the SDO context: the AIA 304 Å image d) and the HMI LOS magnetogram e) during the first scan, and the AIA 171 Å image f) during the third scan. The yellow dotted lines in panels a) and d) outline the envelope containing the two cool loops seen in the IRIS slit-jaw images. The red circles mark the endpoints of these loops. The green arrows in a) and b) indicate the crossing point. The red dashed lines in b) and c) show the positions for time-space diagrams displayed in Fig. 3. The green rectangles in b) and c) are the FOV of Figs. 4 and 6. The center of this image is at solar (x,y) = (319″,102″), and the FOV is 75″ × 50″. The temporal evolution of the IRIS slit-jaw images at 1400 Å of the AIA 304 Å and 171 Å channels the HMI magnetograms is available in the online edition.
Current usage metrics show cumulative count of Article Views (full-text article views including HTML views, PDF and ePub downloads, according to the available data) and Abstracts Views on Vision4Press platform.
Data correspond to usage on the plateform after 2015. The current usage metrics is available 48-96 hours after online publication and is updated daily on week days.
Initial download of the metrics may take a while.