Fig. 6
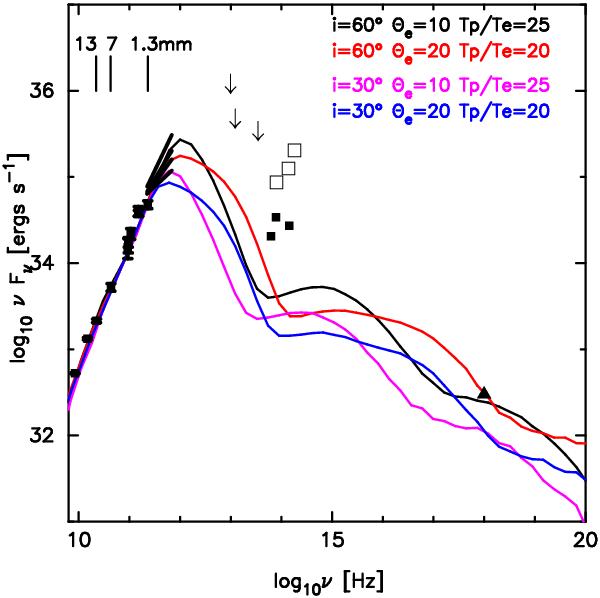
Full SED (including synchrotron and Compton emission) of models which are roughly consistent with the broadband observations of Sgr A* (models # 20, 24, 35, and 39, see Table 1.). The observational data points and upper limits are taken from Falcke et al. (1998), An et al. (2005), Marrone et al. (2006), Melia & Falcke (2001), Doeleman et al. (2008), Schoedel et al. (2011), and the X-ray luminosity of the inner accretion flow is from Neilsen et al. (2013).
Current usage metrics show cumulative count of Article Views (full-text article views including HTML views, PDF and ePub downloads, according to the available data) and Abstracts Views on Vision4Press platform.
Data correspond to usage on the plateform after 2015. The current usage metrics is available 48-96 hours after online publication and is updated daily on week days.
Initial download of the metrics may take a while.