Fig. 8
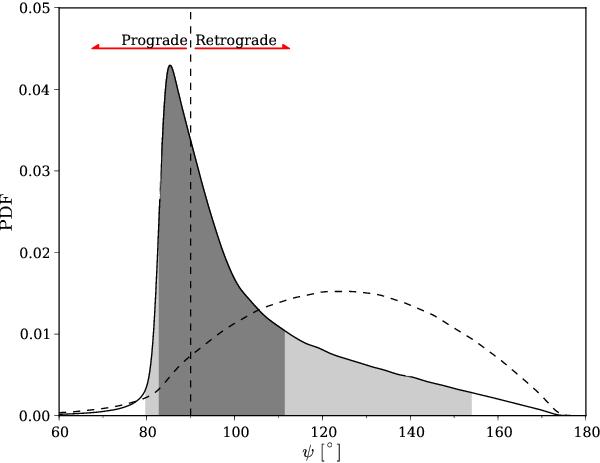
Distribution of the true angle ψ using the distribution for i⋆ from the peak-bagging, and with the assumption of normal distributions for the planetary inclination ip and projected angle λ. For ip the value from Van Eylen et al. (2013) was adopted, while λ was taken from Albrecht et al. (2012). The dark- and light-grey regions of the distribution correspond to the 68% and 95% credible regions. The dashed curve gives the distribution assuming instead an isotropic distribution for i⋆, i.e., flat in cos i⋆. We indicate also which values of ψ correspond to a retrograde or prograde orbit of HAT-P-7b.
Current usage metrics show cumulative count of Article Views (full-text article views including HTML views, PDF and ePub downloads, according to the available data) and Abstracts Views on Vision4Press platform.
Data correspond to usage on the plateform after 2015. The current usage metrics is available 48-96 hours after online publication and is updated daily on week days.
Initial download of the metrics may take a while.