Fig. 7
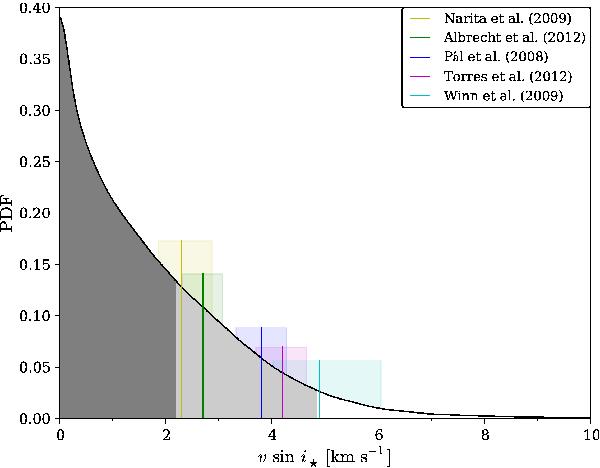
Distribution for v sin i⋆ constructed from the PPDs obtained for νs and i⋆ and assuming  (see Eq. (9)). The dark- and light-grey regions of the distribution correspond to the 68% and 95% credible regions. Literature values for v sin i⋆ obtained from spectral and RM analysis (see Table 3) are given by vertical lines where the shaded regions above the distribution give the corresponding uncertainties.
Current usage metrics show cumulative count of Article Views (full-text article views including HTML views, PDF and ePub downloads, according to the available data) and Abstracts Views on Vision4Press platform.
Data correspond to usage on the plateform after 2015. The current usage metrics is available 48-96 hours after online publication and is updated daily on week days.
Initial download of the metrics may take a while.