Fig. 6
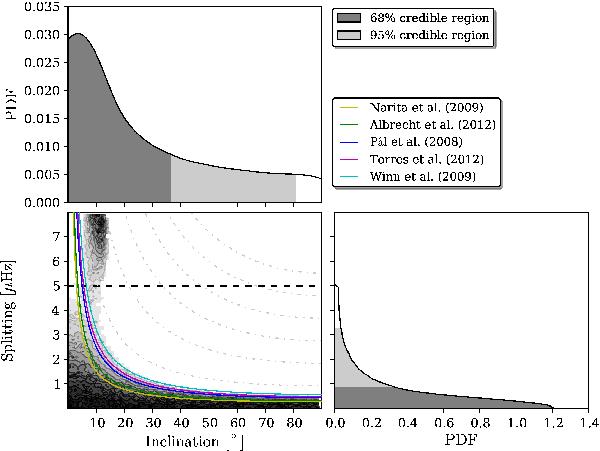
Top: marginalised posterior probability distribution (PPD) for the stellar inclination i⋆. Here we have folded the full distribution (−90 to 180°) onto the the range from 0 to 90°. Bottom right: PPD for the rotational splitting. Bottom left: correlation map between the inclination and the rotational splitting. The 68% credible regions (highest posterior density credible regions) are indicated by the dark-grey parts, while light-grey indicates the additional parts covered in a 95% credible region. Included are also lines of constant v sin i⋆, computed using the radius estimate from our analysis and with v sin i⋆ values from the literature (see Table 3), arranged in the legend in order of increasing v sin i⋆ value (top to bottom). The dashed black horizontal line indicates the value of νs = 5 μHz above which walkers were excluded from the PPDs. The grey dash-dotted lines give lines of constant v sin i⋆ from 8 to 48 km s-1 in steps of 8 km s-1.
Current usage metrics show cumulative count of Article Views (full-text article views including HTML views, PDF and ePub downloads, according to the available data) and Abstracts Views on Vision4Press platform.
Data correspond to usage on the plateform after 2015. The current usage metrics is available 48-96 hours after online publication and is updated daily on week days.
Initial download of the metrics may take a while.