Fig. 5
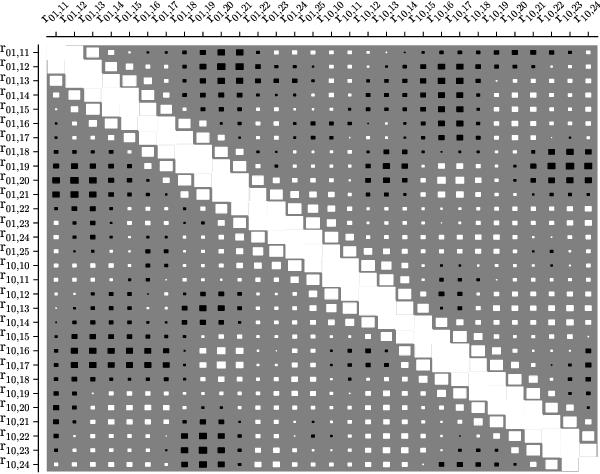
Hinton diagram for the correlation matrix of r010 ratios. The first part of the subscript denotes whether the ratio is of type 01 or 10, while the second gives the radial order of the central frequency. White (black) squares indicate positive (negative) covariances between the ratios in question, and the size gives the relative size of the correlation (one along the diagonal).
Current usage metrics show cumulative count of Article Views (full-text article views including HTML views, PDF and ePub downloads, according to the available data) and Abstracts Views on Vision4Press platform.
Data correspond to usage on the plateform after 2015. The current usage metrics is available 48-96 hours after online publication and is updated daily on week days.
Initial download of the metrics may take a while.