Free Access
Fig. 4
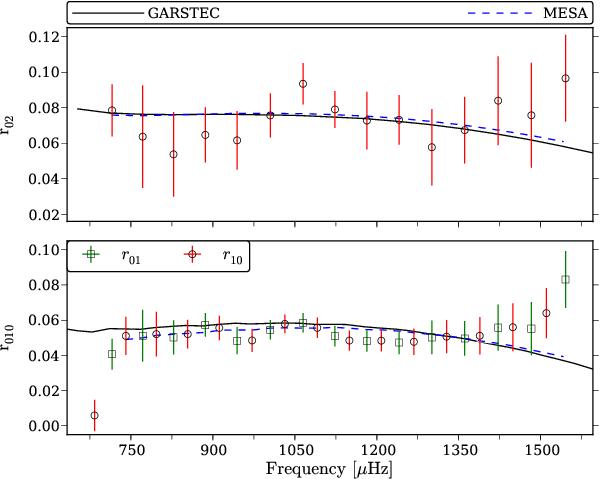
Ratios r02 and r010 as a function of frequency. The lines show the ratios obtained for the best-fit GARSTEC (black solid) and MESA (dashed blue) models. Note that the relatively small uncertainties on frequencies (horizontal error bars) renders them indiscernible on this scale.
Current usage metrics show cumulative count of Article Views (full-text article views including HTML views, PDF and ePub downloads, according to the available data) and Abstracts Views on Vision4Press platform.
Data correspond to usage on the plateform after 2015. The current usage metrics is available 48-96 hours after online publication and is updated daily on week days.
Initial download of the metrics may take a while.