Fig. 3
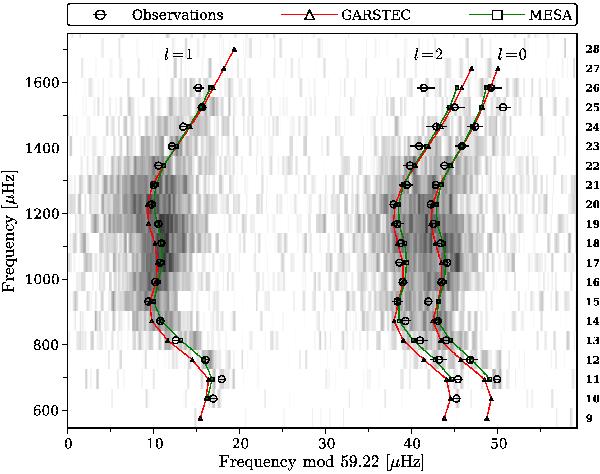
Échelle diagram for HAT-P-7 using Δν = 59.22 μHz. The grey scale ranges from white at low power to black at high power. Circles give the extracted frequencies with corresponding uncertainties, triangles connected by red lines give model frequencies from GARSTEC, while squares connected by green lines give model frequencies from MESA. The degree of each ridge is indicated in the top part of the plot. The radial order of the l = 0 modes is indicated by the numbers at the right side of the plot.
Current usage metrics show cumulative count of Article Views (full-text article views including HTML views, PDF and ePub downloads, according to the available data) and Abstracts Views on Vision4Press platform.
Data correspond to usage on the plateform after 2015. The current usage metrics is available 48-96 hours after online publication and is updated daily on week days.
Initial download of the metrics may take a while.