Fig. 2
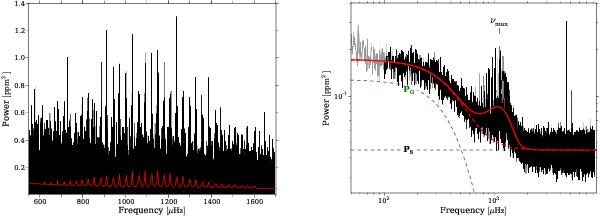
Left: power spectrum of HAT-P-7 (black) with the fitted model over-plotted (red; cf. Eq. (1)). Right: power spectrum of HAT-P-7 (black) over-plotted with the best fit to the background (red; cf. Eq. (2)). The light-grey part up to 100 μHz was not included in the fit. The fit includes a granulation component (PG; green) and a white/shot noise (PS; black) level in addition to the Gaussian envelope from p-modes centred around νmax ≈ 1115 μHz. The dashed red line shows the background fit without the Gaussian envelope.
Current usage metrics show cumulative count of Article Views (full-text article views including HTML views, PDF and ePub downloads, according to the available data) and Abstracts Views on Vision4Press platform.
Data correspond to usage on the plateform after 2015. The current usage metrics is available 48-96 hours after online publication and is updated daily on week days.
Initial download of the metrics may take a while.