Fig. B.1
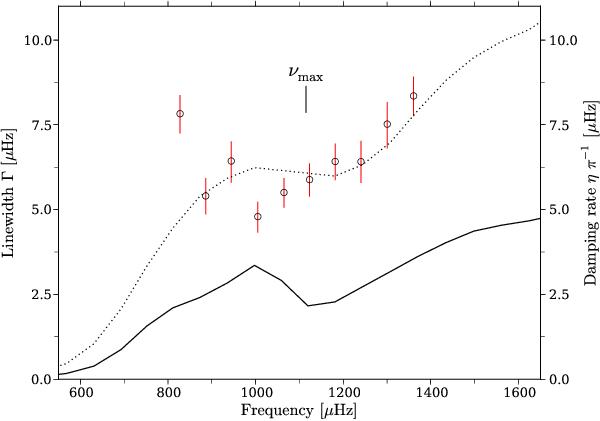
Measured line widths for radial-order modes are given by the open symbols as a function of frequency (left axis), and plotted with associated errors. Theoretical linear damping rates, multiplied by two, are shown by the solid curve (right axis). The dotted curve shows smoothed damping rates, multiplied by a factor of 2.2. Inputs to the theoretical model were taken from the best-fit GARSTEC model, e.g. the radius at the base of the surface convection zone (Rbcz/R⋆ = 0.862).
Current usage metrics show cumulative count of Article Views (full-text article views including HTML views, PDF and ePub downloads, according to the available data) and Abstracts Views on Vision4Press platform.
Data correspond to usage on the plateform after 2015. The current usage metrics is available 48-96 hours after online publication and is updated daily on week days.
Initial download of the metrics may take a while.