Fig. 11
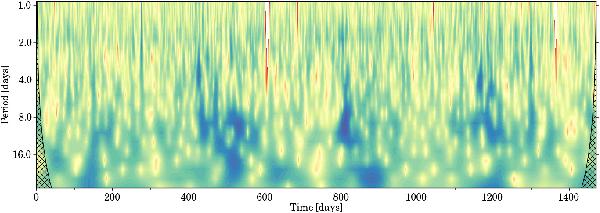
Morlet wavelet power spectrum as a function of time for HAT-P-7, where the time series was binned by 31 points. The colour changes from red at low power to blue at high power – the colours are on a logarithmic scale. The cross-hatched regions at high and low times indicate the cone of influence where edge effects become important (see Torrence & Compo 1998). No clear signatures from rotation are apparent.
Current usage metrics show cumulative count of Article Views (full-text article views including HTML views, PDF and ePub downloads, according to the available data) and Abstracts Views on Vision4Press platform.
Data correspond to usage on the plateform after 2015. The current usage metrics is available 48-96 hours after online publication and is updated daily on week days.
Initial download of the metrics may take a while.