Free Access
Fig. 10
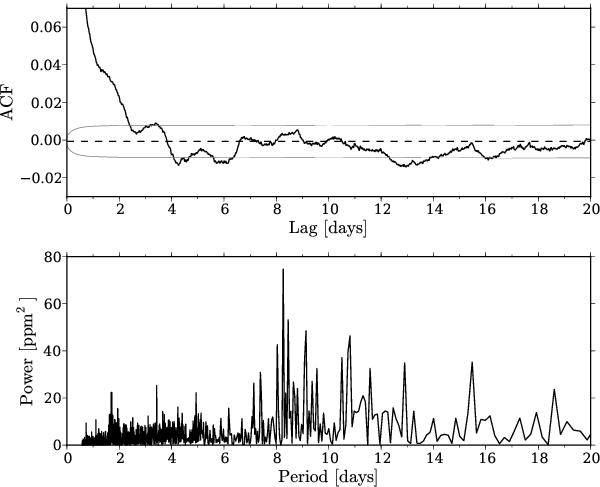
Top: autocorrelation function (ACF) of the HAT-P-7 time series (black). The dashed horizontal line gives the expectation value for random independent and identically distributed values, while the grey curves give the large-lag 95% confidence levels. Bottom: low-frequency end of the power spectrum in units of period.
Current usage metrics show cumulative count of Article Views (full-text article views including HTML views, PDF and ePub downloads, according to the available data) and Abstracts Views on Vision4Press platform.
Data correspond to usage on the plateform after 2015. The current usage metrics is available 48-96 hours after online publication and is updated daily on week days.
Initial download of the metrics may take a while.