Fig. 1
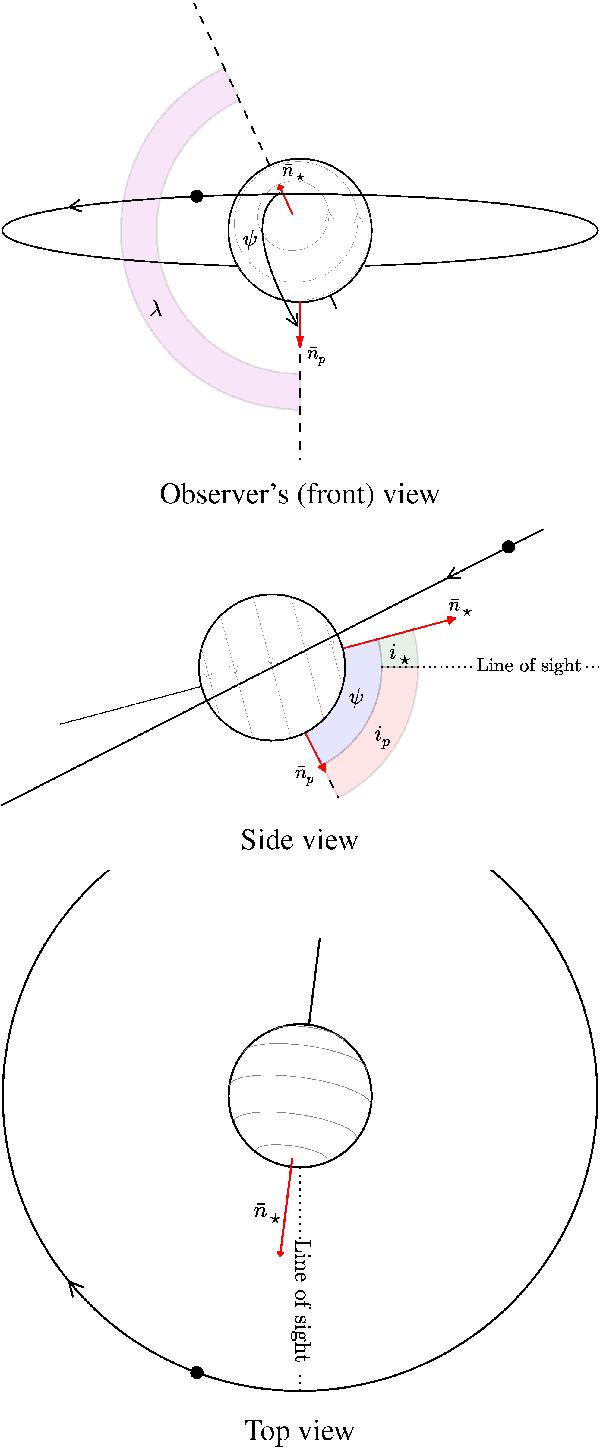
Configuration of the HAT-P-7 system to scale using values for HAT-P-7b (full black circle) from Van Eylen et al. (2013). Top: the observer’s view of the system from Earth, with the angular momentum vectors of the planetary orbit,  (normal to the orbital plane), and stellar spin,
  , given as red arrows. The projected angle, λ, is indicated by the shaded magenta region and is found as the angle between and when these are projected onto the plane of the sky (dashed lines). This angle is obtained from RM measurements, and in this panel we have used λ = 155 ± 37° following Albrecht et al. (2012; the uncertainty on λ is not included in the figure). The stellar inclination, i⋆, which is the parameter measured from asteroseismology, is set to 15°, and is given by the direct angle between the line of sight (midpoint of star) and . The inclination of the planetary orbit, ip, is set to 83° following Van Eylen et al. (2013). The true angle, ψ, is the direct angle between and . Middle: side view of the system, with the observer’s view-point from the right, indicated by “line of sight”. To properly show i⋆ (shaded green) and ip (shaded red), and not their projected values, we have set λ = 180° such that both and lie on the same plane as the line of sight. For illustrative purposes we have in addition decreased ip to 63°. When adopting this configuration ψ (shaded blue) is given by the sum of i⋆ and ip. Bottom: top view of the system, with the observer’s view-point from the bottom, indicated by “line of sight”.
Current usage metrics show cumulative count of Article Views (full-text article views including HTML views, PDF and ePub downloads, according to the available data) and Abstracts Views on Vision4Press platform.
Data correspond to usage on the plateform after 2015. The current usage metrics is available 48-96 hours after online publication and is updated daily on week days.
Initial download of the metrics may take a while.