Fig. 9
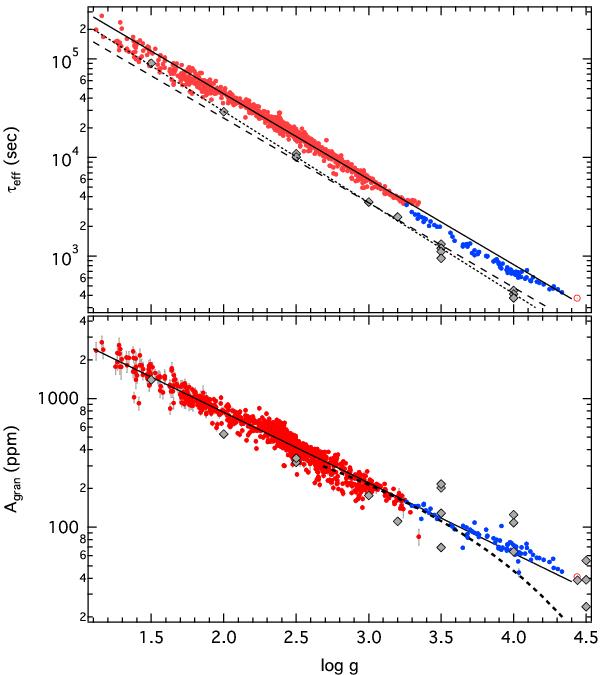
Characteristic timescale τeft (top) and intensity fluctuations Agran (bottom) as a function of log g for our sample of LC (red) and SC (blue) stars. Solid lines correspond to power law fits. The dashed line in the top panel corresponds to a power law fit to effective timescales obtained from 3D simulations (Mathur et al. 2011). Diamond symbols indicate values obtained from the granulation spectrum of 3D hydrodynamical models (Samadi et al. 2013b) and the dotted line corresponds to a power law fit to these models. The dashed line in the bottom panel shows the relation between the 8 h-flicker amplitude and log g.
Current usage metrics show cumulative count of Article Views (full-text article views including HTML views, PDF and ePub downloads, according to the available data) and Abstracts Views on Vision4Press platform.
Data correspond to usage on the plateform after 2015. The current usage metrics is available 48-96 hours after online publication and is updated daily on week days.
Initial download of the metrics may take a while.