Fig. 8
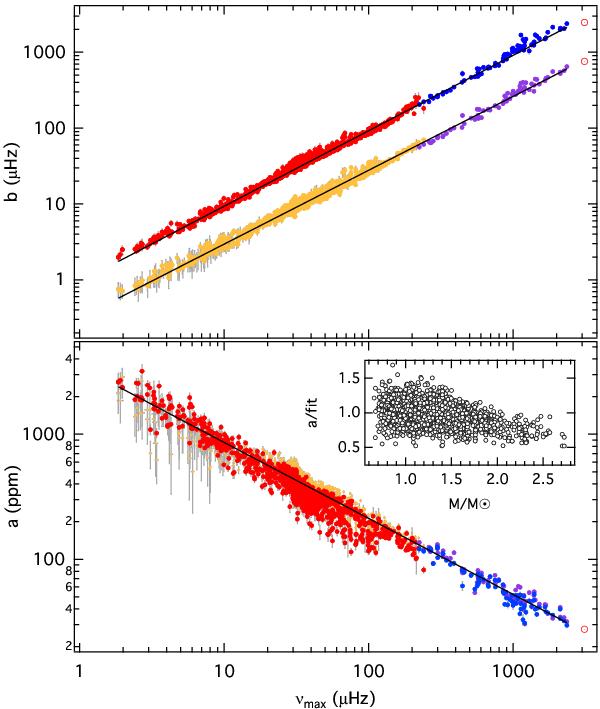
Characteristic frequencies (top) and rms amplitudes (bottom) as a function of νmax for our sample of LC (red/orange) and SC (blue/magenta) stars. Orange and magenta coloured symbols correspond to the lower frequency component (a1 and b1). Black lines indicate power law fits (see Table 2) and red open circles solar values. The insert shows the rms amplitudes of the LC sample divided by the power law fit as a function of stellar mass.
Current usage metrics show cumulative count of Article Views (full-text article views including HTML views, PDF and ePub downloads, according to the available data) and Abstracts Views on Vision4Press platform.
Data correspond to usage on the plateform after 2015. The current usage metrics is available 48-96 hours after online publication and is updated daily on week days.
Initial download of the metrics may take a while.