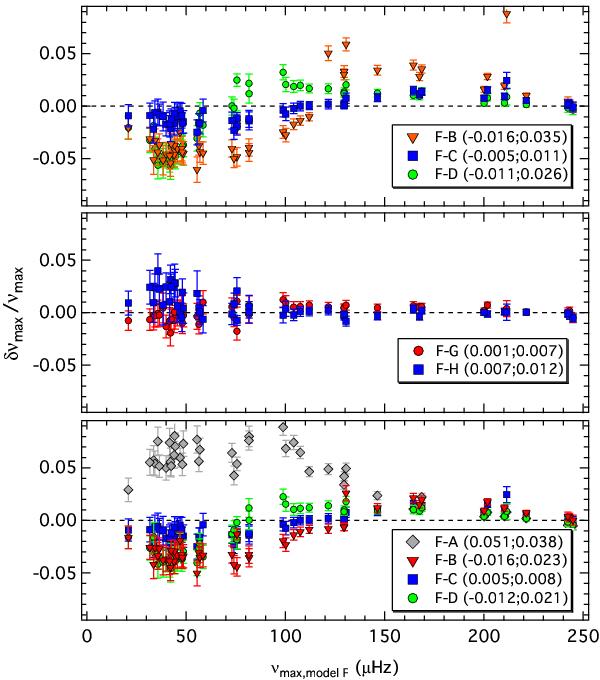
Fig. 6

Relative differences in νmax between model F and various other models for a sample of 50 red giants. The average relative difference and standard deviation is given in brackets. The top and middle panel show δνmax that result from fitting the entire spectrum (i.e., global fit) while in the bottom panel the fits are restricted to the range around the power excess hump (i.e., local fit). In both cases, there are clear systematic differences between 1- and 2-component models.
Current usage metrics show cumulative count of Article Views (full-text article views including HTML views, PDF and ePub downloads, according to the available data) and Abstracts Views on Vision4Press platform.
Data correspond to usage on the plateform after 2015. The current usage metrics is available 48-96 hours after online publication and is updated daily on week days.
Initial download of the metrics may take a while.


