Fig. 5
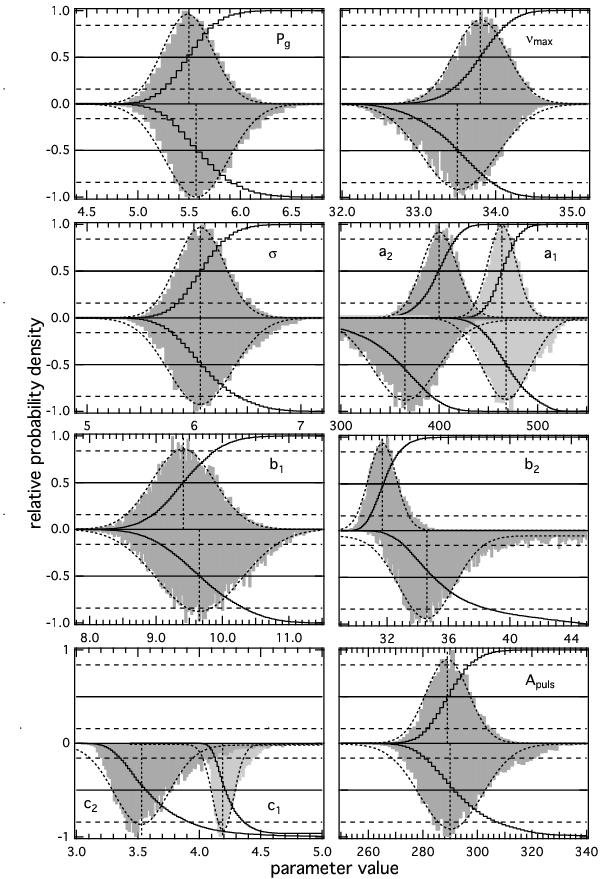
Histograms (grey bars) and cumulative distributions (black lines) of the probability density for the parameters determined for model F (pointing upwards) and model H (pointing downwards) for KIC 7949599, showing that all common parameters are practically equivalent (within the uncertainties). Horizontal solid and dashed lines indicate the median value and the ± 1σ limits (of a normal distribution), respectively. Vertical dotted lines mark the centre of a Gaussian fit to the histograms. The parameters units are the same as in Table 1.
Current usage metrics show cumulative count of Article Views (full-text article views including HTML views, PDF and ePub downloads, according to the available data) and Abstracts Views on Vision4Press platform.
Data correspond to usage on the plateform after 2015. The current usage metrics is available 48-96 hours after online publication and is updated daily on week days.
Initial download of the metrics may take a while.