Free Access
Fig. 4
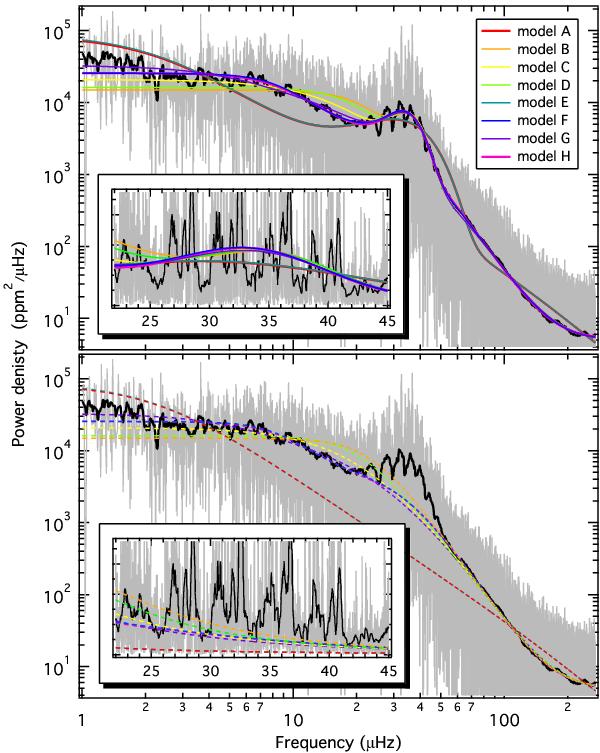
Raw (grey) and heavily smoothed (black) power density spectrum of KIC 7949599. Over-plotted in colour are the best fits model with (top panel) and without (bottom panel) the Gaussian component. Note that model A and E and model F and G effectively overlap. The inserts show enlarged sections around νmax.
Current usage metrics show cumulative count of Article Views (full-text article views including HTML views, PDF and ePub downloads, according to the available data) and Abstracts Views on Vision4Press platform.
Data correspond to usage on the plateform after 2015. The current usage metrics is available 48-96 hours after online publication and is updated daily on week days.
Initial download of the metrics may take a while.