Fig. 3
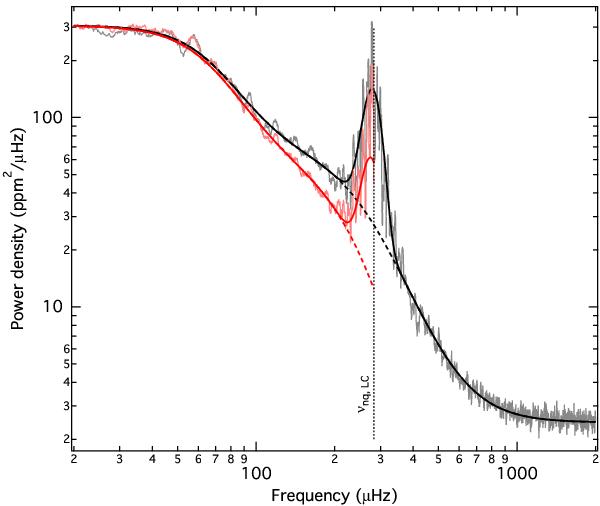
Heavily smoothed (5 μHz boxcar filter) power density spectrum of the about 540 and 1000 day-long SC (grey line) and LC Kepler time series (light-red line), respectively, of KIC 5596656. The black lines correspond to the best-fit model for the SC data with (full line) and without (dashed line) the Gaussian component. The red lines indicate the SC model corrected for the amplitude suppression due to the longer sampling. The vertical dotted line marks the Nyquist frequency for the LC sampling.
Current usage metrics show cumulative count of Article Views (full-text article views including HTML views, PDF and ePub downloads, according to the available data) and Abstracts Views on Vision4Press platform.
Data correspond to usage on the plateform after 2015. The current usage metrics is available 48-96 hours after online publication and is updated daily on week days.
Initial download of the metrics may take a while.