Fig. 2
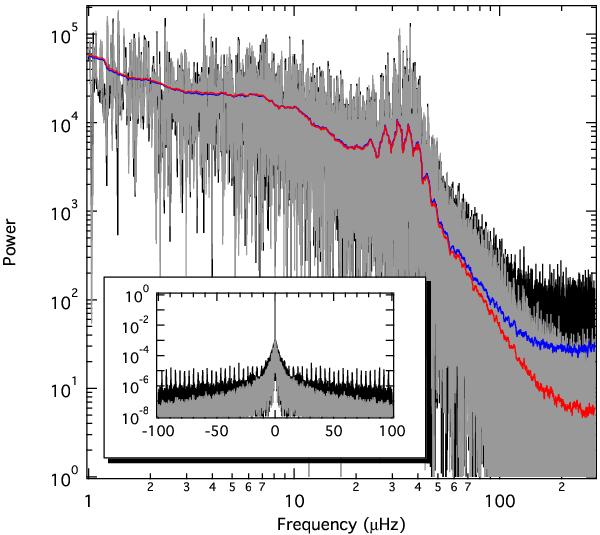
Power spectrum of KIC 7949599. The black and grey lines indicate the spectrum of the raw data (duty cycle of ~93%) and after filling all gaps shorter than 1 day (duty cycle of ~95%), respectively, showing how low-frequency signal leaks into the high-frequency range via the spectral window (see insert). The blue and red lines correspond to heavily smoothed versions of the raw and gap-filled spectrum, respectively.
Current usage metrics show cumulative count of Article Views (full-text article views including HTML views, PDF and ePub downloads, according to the available data) and Abstracts Views on Vision4Press platform.
Data correspond to usage on the plateform after 2015. The current usage metrics is available 48-96 hours after online publication and is updated daily on week days.
Initial download of the metrics may take a while.