Free Access
Fig. 10
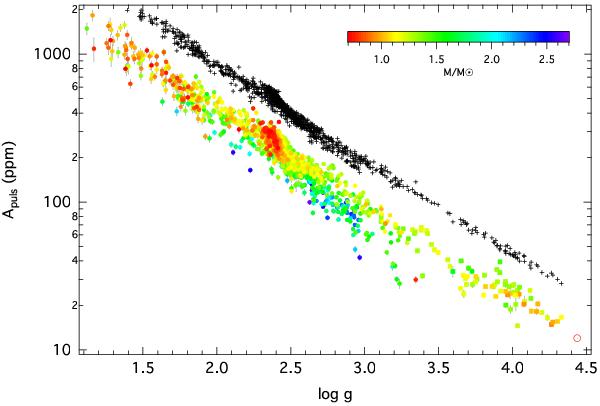
Total pulsation amplitude as a function of log g for our sample of LC (circles) and SC (squares) stars, with the colour encoding stellar mass. Black crosses indicate pulsation amplitudes predicted from a power law fit of the form Apuls ∝ (g2M)− s (shifted by a factor of 2 for better visibility).
Current usage metrics show cumulative count of Article Views (full-text article views including HTML views, PDF and ePub downloads, according to the available data) and Abstracts Views on Vision4Press platform.
Data correspond to usage on the plateform after 2015. The current usage metrics is available 48-96 hours after online publication and is updated daily on week days.
Initial download of the metrics may take a while.