Fig. 4
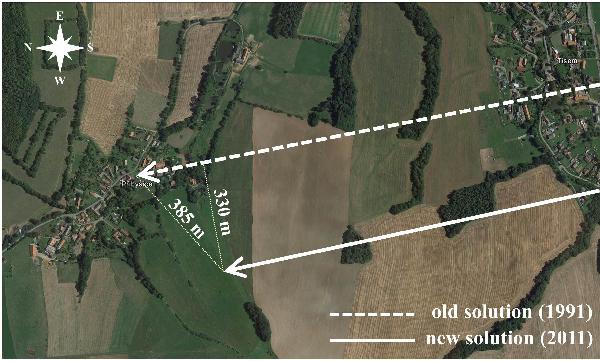
Detail of the terminal part of the Benešov bolide, where the projection of the original trajectory solution (dashed line) is plotted along with the new solution from 2011(filled line). This includes all corrections discussed in Sect. 3. The shift between these two solutions is about 330 m westward (source of maps: Google Earth).
Current usage metrics show cumulative count of Article Views (full-text article views including HTML views, PDF and ePub downloads, according to the available data) and Abstracts Views on Vision4Press platform.
Data correspond to usage on the plateform after 2015. The current usage metrics is available 48-96 hours after online publication and is updated daily on week days.
Initial download of the metrics may take a while.