Fig. 7
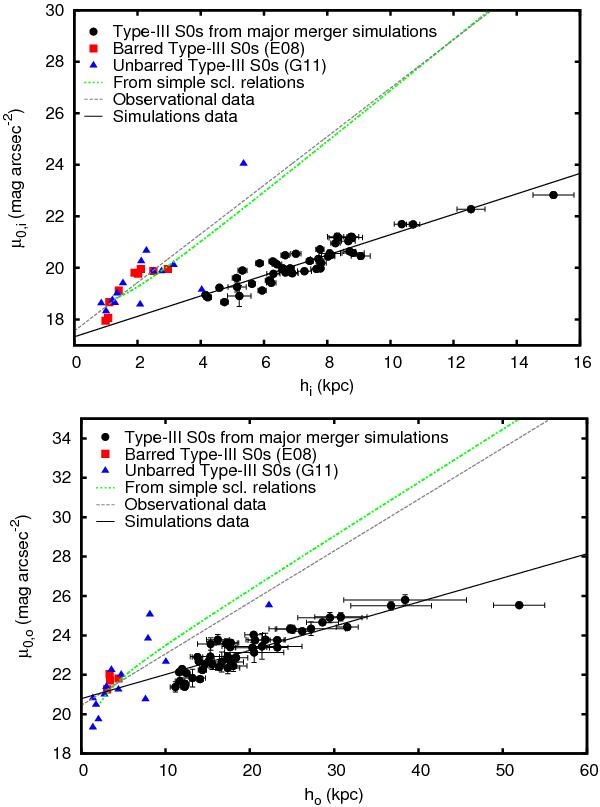
Distributions of our Type III S0-like remnants in the diagrams of μ0,i vs. hi and μ0,o vs. ho compared to the antitruncated S0s in the reference observational sample (E08; G11). Solid lines: linear fits to our simulations sample. Dashed lines: linear fits to the observational data by E08 and G11. Dotted line: expected relations derived from the simple observational scaling relations hi ∝ RbrkIII, ho ∝ RbrkIII, and μbrkIII ∝ RbrkIII (see Sect. 3.6). Consult the legend in the figure. (Color version online.)
Current usage metrics show cumulative count of Article Views (full-text article views including HTML views, PDF and ePub downloads, according to the available data) and Abstracts Views on Vision4Press platform.
Data correspond to usage on the plateform after 2015. The current usage metrics is available 48-96 hours after online publication and is updated daily on week days.
Initial download of the metrics may take a while.