Fig. 4
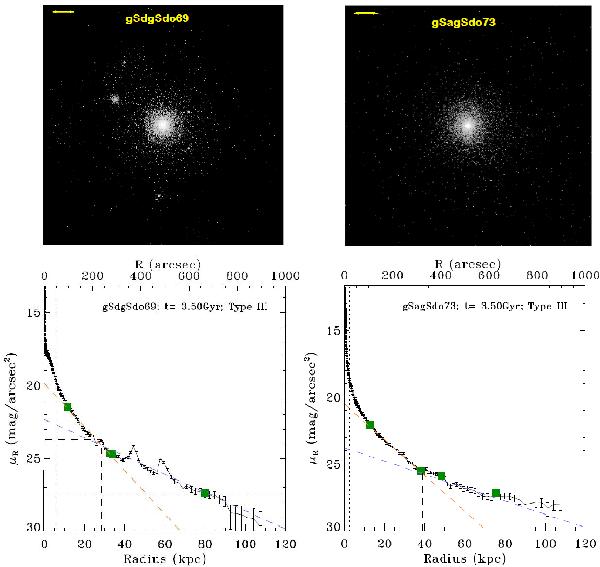
Comparison between the R-band images and surface brightness profiles of a remnant that develops several tidal satellites (model gSdgSdo69, on the left) and one that does not (gSagSdo73, on the right). Top panels: R-band simulated image for the face-on view of each remnant, where tidal satellites can be easily identified. Bottom panels: R-band surface brightness profiles simulated in each case, showing peaks at the radial positions where the remnants present a satellite. (Color version online.)
Current usage metrics show cumulative count of Article Views (full-text article views including HTML views, PDF and ePub downloads, according to the available data) and Abstracts Views on Vision4Press platform.
Data correspond to usage on the plateform after 2015. The current usage metrics is available 48-96 hours after online publication and is updated daily on week days.
Initial download of the metrics may take a while.