Fig. 3
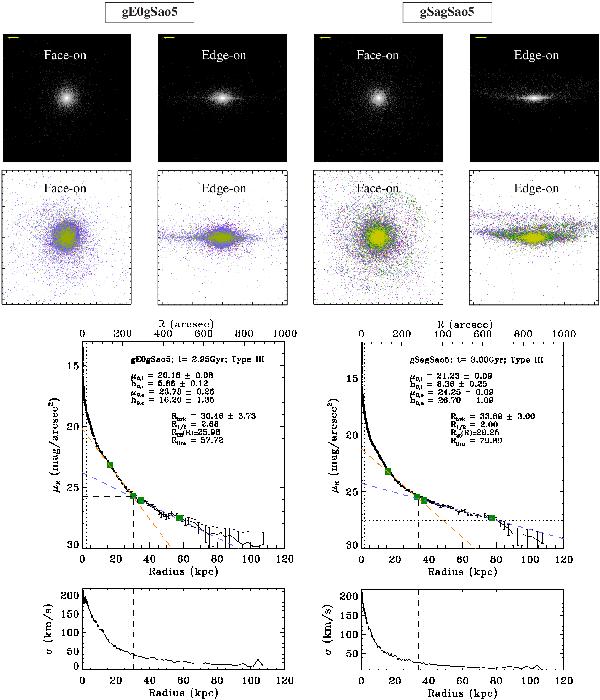
Simulated R-band images and radial surface brightness profiles of some Type III S0-like remnants. The simulations assume D = 30 Mpc, μR,lim = 27.5 mag arcsec-2, and a spatial resolution of 0.7′′. Top panels: simulated R-band photometric images of the final remnants for face-on and edge-on views (see Sect. 2.2). The yellow segment represents a physical length of 10 kpc. The field of view is 100 kpc × 100 kpc in all panels. We use logarithmic grey scale. Intermediate panels: maps of projected locations of the stellar particles in the same remnant, for the same projections and fields of view as in the top panels. The colour code of the particles is the same as in Fig. 1. Bottom panels: R-band surface brightness profile (μR(r)) and radial profile of the dispersion of velocities in the remnant (σ). Black dots: simulated data. Dotted horizontal line: limiting surface brightness. Green squares: minimum and maximum radial limits considered for the piecewise fits. [The legend continues on the next page].
Current usage metrics show cumulative count of Article Views (full-text article views including HTML views, PDF and ePub downloads, according to the available data) and Abstracts Views on Vision4Press platform.
Data correspond to usage on the plateform after 2015. The current usage metrics is available 48-96 hours after online publication and is updated daily on week days.
Initial download of the metrics may take a while.