Fig. 16
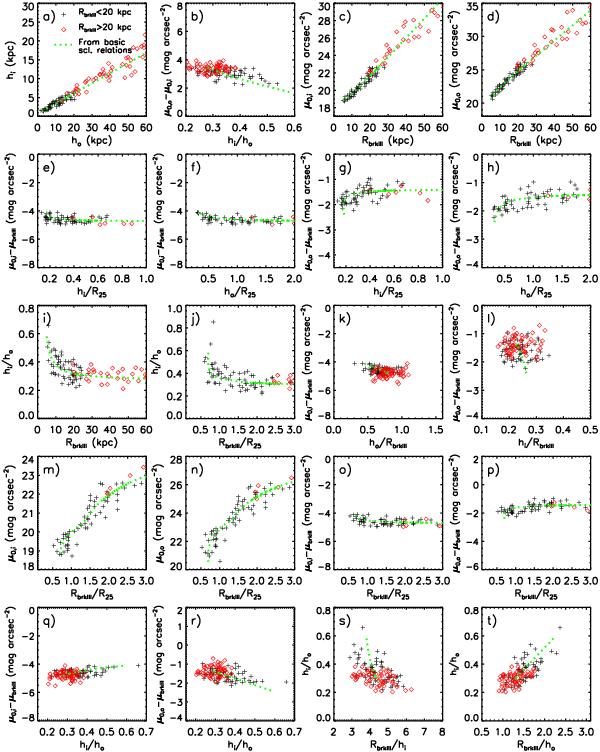
Trends expected in several photometric planes from the modelling obtained from three basic scaling relations fulfilled by real and simulated Type III S0s (dashed lines): hi ∝ RbrkIII, ho ∝ RbrkIII, and μbrkIII ∝ RbrkIII. The observational relations have been assumed for the modelling (see Sect. 3.6). We have overplotted the locations expected from this modelling for 60 values of RbrkIII, but inserting typical observational errors in the scalelengths and surface brightness values at random (symbols). We have distinguished the predictions with RbrkIII < 20 kpc (crosses) from those with RbrkIII> 20 kpc (diamonds), to compare them with the distributions of the observational data (typically with RbrkIII < 20 kpc) and of our S0-like remnants (with RbrkIII> 20 kpc) in the figures above. Accounting for errors, the modelling is capable of reproducing the distributions of real data in these planes (compare with the corresponding diagrams in Figs. 5–15). (Color version online.)
Current usage metrics show cumulative count of Article Views (full-text article views including HTML views, PDF and ePub downloads, according to the available data) and Abstracts Views on Vision4Press platform.
Data correspond to usage on the plateform after 2015. The current usage metrics is available 48-96 hours after online publication and is updated daily on week days.
Initial download of the metrics may take a while.