Fig. 9
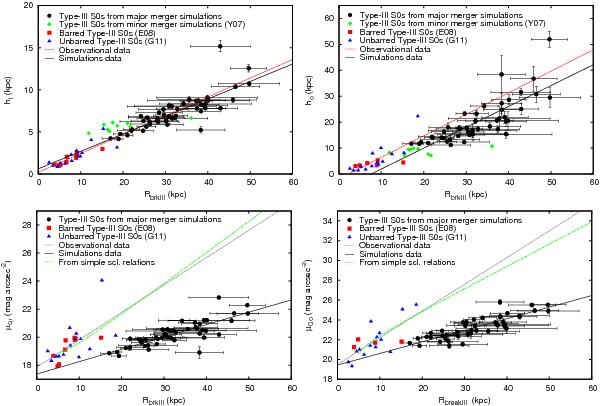
Trends of the photometric parameters of the inner and outer discs with the antitruncation radius, compared to real data on Type III S0 galaxies (E08; G11). Top: R-band scalelengths of the inner and outer discs vs. RbrkIII (left and right panels, respectively). The fits performed to observations in these planes are two of the three simple scaling relations from which the relations observed in the rest of photometric planes can be derived (see Sect. 3.6), so they have been remarked in red. Data of the antitruncations formed in the minor merger simulations by Y07 are overplotted for comparison. Bottom: R-band central surface brightness of the inner and outer discs vs. RbrkIII (left and right panels). Solid lines: linear fits to our simulations sample. Dashed lines: linear fits to the observational data by E08 and G11. Dotted-dashed line: expected relations assuming the simple scaling relations hi ∝ RbrkIII, ho ∝ RbrkIII, and μbrkIII ∝ RbrkIII obtained from data (see Sect. 3.6). Consult the legend in the figure. (Color version online.)
Current usage metrics show cumulative count of Article Views (full-text article views including HTML views, PDF and ePub downloads, according to the available data) and Abstracts Views on Vision4Press platform.
Data correspond to usage on the plateform after 2015. The current usage metrics is available 48-96 hours after online publication and is updated daily on week days.
Initial download of the metrics may take a while.