Free Access
Fig. 7
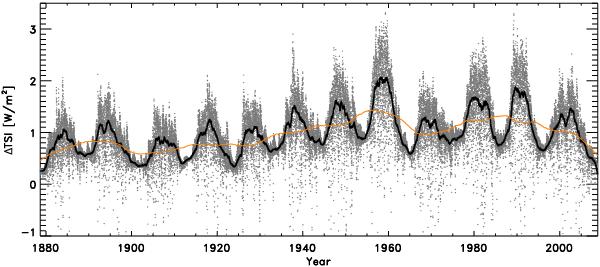
Change in TSI relative to the quiet Sun value, ΔTSI, between 1878 and 2009. Daily values are indicated by the light grey dots, and the yearly and 11-year smoothed values are depicted by black and orange curves, respectively.
Current usage metrics show cumulative count of Article Views (full-text article views including HTML views, PDF and ePub downloads, according to the available data) and Abstracts Views on Vision4Press platform.
Data correspond to usage on the plateform after 2015. The current usage metrics is available 48-96 hours after online publication and is updated daily on week days.
Initial download of the metrics may take a while.