Fig. 3
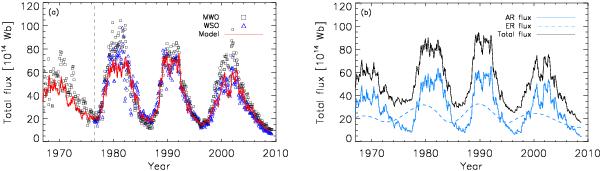
a) Modelled total magnetic flux (solid red), 0.68ΦAR + 0.4ΦER (see Sect. 3.3), compared with the observations from the Wilcox Solar Observatory (blue triangles) and the Mount Wilson Observatory (black squares). The vertical dashed line indicates the time when the data from the Mount Wilson observatory become available. b) Modelled magnetic flux from active regions (0.68ΦAR; solid blue), ephemeral regions (ΦER; dashed blue), and the total magnetic flux (0.68ΦAR + ΦER; solid black).
Current usage metrics show cumulative count of Article Views (full-text article views including HTML views, PDF and ePub downloads, according to the available data) and Abstracts Views on Vision4Press platform.
Data correspond to usage on the plateform after 2015. The current usage metrics is available 48-96 hours after online publication and is updated daily on week days.
Initial download of the metrics may take a while.