Fig. 5
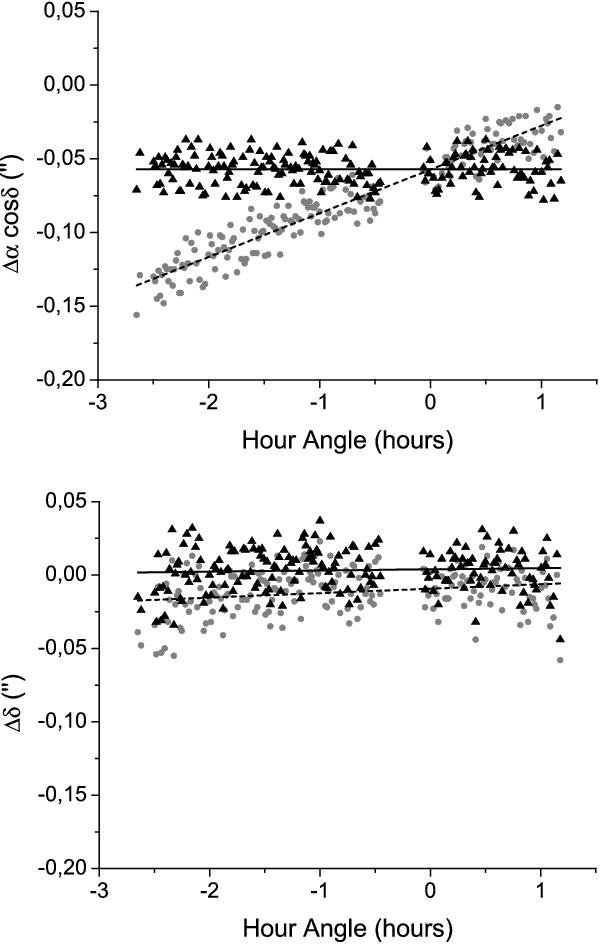
An example of the differential chromatic refraction correction applied for one night of observations with the 0.6 m Bollen & Chivens OPD telescope on April 18, 2007 – in right ascension (top) and declination (bottom). Gray dots represent the position offsets with regard to the ephemeris before the correction and black triangles after. The dashed line is the linear fit to the data without the refraction correction, and the full line is the linear fit to the corrected data. On this plot, △ B = 0.083.
Current usage metrics show cumulative count of Article Views (full-text article views including HTML views, PDF and ePub downloads, according to the available data) and Abstracts Views on Vision4Press platform.
Data correspond to usage on the plateform after 2015. The current usage metrics is available 48-96 hours after online publication and is updated daily on week days.
Initial download of the metrics may take a while.